

Understanding Chart Patterns for Traders
📈 Master key chart patterns for trading success! Discover their uses, pros, cons & find trusted PDF guides for South African investors wanting to improve skills.
Edited By
Oliver Hughes
Forex trading hinges largely on understanding price movements, and chart patterns stand as one of the most practical tools to make sense of these shifts. Instead of guessing, traders can identify recurring formations in charts which often hint at what the market might do next. This makes recognising these patterns less about luck and more about skill.
In this guide, we’ll break down common Forex chart patterns such as head and shoulders, double tops and bottoms, pennants, and flags with a focus on how you can spot them in charts and apply them directly to your trading strategy. These aren’t just theoretical shapes—they form the backbone of many traders’ decision-making processes, helping to time entries and exits more accurately.

Familiarity with chart patterns can sharpen your intuition, giving you a much-needed edge, especially in volatile markets like Forex where prices can swing sharply and unpredictably.
Here’s what you’ll gain:
Clarity on pattern identification: Knowing what each pattern looks like visually and the psychology behind price action.
Practical application: How to use these patterns for better timing in buying or selling currency pairs.
PDF resources: Access to downloadable guides which you can print out or keep on your device for quick reference while analysing charts.
For example, spotting a "double bottom" pattern near a key support level on the USD/ZAR chart could hint at a strong bounce, signalling a buying opportunity. On the flip side, recognising a "head and shoulders" formation on EUR/USD might prepare you for a reversal, allowing you to protect gains or set sell positions.
Combining pattern recognition with fundamentals and local market conditions—like Eskom’s load-shedding impact or shifts in SARB interest rates—can refine your strategy further. This guide doesn’t just introduce patterns; it ties them into the realities unique to South African and global Forex trading.
Understanding these patterns is not a silver bullet but a tool in your toolbox. Use it alongside solid risk management and you’ll build confidence to navigate the often unpredictable Forex market.
Ready to upgrade your charts with practical insight? Let’s get into the key patterns and how to work with them effectively.
Chart patterns play a vital role in forex trading by helping traders interpret market behaviour visually. They are sequences of price movements plotted on charts that often repeat themselves, signalling potential future trends. Getting to grips with these patterns offers a more structured way to understand price action beyond just guessing or relying solely on news events.
In practice, recognising chart patterns can guide traders on when to enter or exit positions, improving timing and decision-making. For example, spotting a "head and shoulders" formation might warn a trader that a bullish trend is about to turn bearish, prompting protective moves or profit-taking.
Definition of chart patterns: Chart patterns are distinct shapes or formations created by the price action of a currency pair on a trading chart. Think of these as a map marking where price has paused, reversed, or continued in the past. Patterns like triangles, flags, or double tops form because market psychology tends to repeat under similar conditions.
Role in predicting price movements: These patterns give clues about the balance between buyers and sellers. For instance, a breakout above a resistance line in a triangle pattern often hints at a strong upward move. It's like the market taking a deep breath before making a decisive change in direction. But, it’s never guaranteed; traders must confirm with volume or other indicators.
Importance for traders: For many traders, chart patterns offer a more hands-on tool to anticipate price shifts without waiting for delayed fundamental news. They provide a visual framework to spot risks or opportunities early. Especially for intraday and swing traders, pattern recognition can mean the difference between catching a run or missing out.
Understanding chart patterns isn’t just for experts; it’s a skill that’s accessible and practical, helping you read the market’s subtle messages.
Reversal patterns signal a likely change in trend direction. For example, a double top often indicates the end of an uptrend, where the price hits a high twice but fails to break through, suggesting sellers are gaining ground. Recognising these can help avoid entering trades at the wrong time or lock in profits before a downturn.
Continuation patterns suggest the current trend will carry on after a short pause. Flags and pennants are small, angled consolidations that usually follow a sharp price move. After the market takes a breather, it’s likely to resume its direction. Traders use these to add to winning positions or confirm their bias.
Bilateral patterns are a bit trickier, as they don’t point clearly up or down but suggest a breakout in either direction is possible. Triangles can fall into this category when symmetrical; the market tightens without clear bias. Trading these requires cautious stop-loss strategies and readiness to react quickly once price breaks out.
Knowing these pattern types means you can adapt your approach depending on market signals instead of sticking blindly to one style. It’s the difference between being reactive and proactive.
Understanding key Forex chart patterns helps traders spot potential market turning points and continuation moves. These patterns distil price action into visual shapes, offering clues about where the market might go next. Getting these patterns right can improve timing decisions and risk control.

The head and shoulders pattern signals a likely trend reversal, often from bullish to bearish. It features three peaks: two smaller shoulders and a higher middle peak (the head). For example, if the upward trend in EUR/USD shows this shape forming on a 4-hour chart, it could warn traders prices may fall soon. The neckline connecting the lows between peaks acts as a trigger point—once broken downward, it confirms the reversal. The reverse head and shoulders works similarly for a bullish reversal.
Double tops and bottoms consist of two price peaks or troughs at roughly the same level. A double top forms after an uptrend and suggests resistance the market struggles to break, pointing to a possible fall. Conversely, a double bottom appears after a downtrend, indicating support that might lead to a bounce upward. For instance, a USD/ZAR double bottom on a daily chart near R16 might encourage buyers, expecting prices to rise. Confirming these patterns with volume dips and breakouts helps avoid false signals.
Triple tops and bottoms extend the double pattern, showing three peaks or troughs around the same price. They reinforce strong resistance or support levels, hence greater reliability. Take a triple top forming near R18 on GBP/ZAR daily chart—each failed attempt to break higher strengthens the case for a decline. Triple bottom formations similarly suggest reliable floors. Traders use these to set entry and exit points, often placing stop-loss orders beyond the pattern extremes.
Flags and pennants are short-term continuation patterns appearing after sharp price moves. Flags resemble small rectangles or parallelograms slanting opposite to the trend, while pennants look like small symmetrical triangles. Both signal a brief consolidation before the original move resumes. For example, after a steep rise in USD/JPY, a flag forming over a couple of days indicates that the upward momentum is likely to continue. They’re handy for spotting pullbacks within strong trends.
Triangles indicate tightening price action and hesitation before a likely breakout. An ascending triangle has a flat upper resistance and rising support, often leading to an upside breakout. Descending triangles show a flat support with descending resistance, hinting at a down move. Symmetrical triangles look like converging lines with no clear directional bias and breakouts can go either way. Suppose an ascending triangle forms on the ZAR/JPY daily chart; traders watch for a break above resistance to enter long positions.
Rectangles mark periods where price moves sideways between clear support and resistance levels, reflecting market indecision. These can last days or weeks. Breakouts above or below the rectangle signal potential trend continuations or reversals. For instance, the USD/CAD might trade between 1.28 and 1.30 for weeks forming a rectangle; a move beyond 1.30 with volume signals a new upward leg. Rectangles help traders define explicit targets and stop-loss points based on these zones.
Spotting these chart patterns empowers traders to read market psychology visually. While not guaranteed, combining patterns with volume and other indicators sharpens trade timing.
This overview equips you with practical knowledge to identify major pattern types and interpret them effectively in Forex markets.
Analysing chart patterns in Forex trading is more than just recognising shapes on a chart—it requires practical strategies to confirm these patterns and integrate them with other tools for better decision-making. Relying solely on visual patterns can lead to false signals and missed opportunities, so it’s vital to understand how volume, time frames, and other technical indicators can verify and strengthen your analysis.
Confirming patterns with volume helps traders distinguish between genuine moves and false breakouts. For instance, a classic head and shoulders reversal should ideally be accompanied by higher volume on the breakout to confirm sellers’ strength. Low volume during a breakout might signal a lack of conviction, suggesting the price could reverse quickly. In South African markets, where liquidity can vary across pairs, watching volume carefully guards against fakeouts that hit stop-loss orders unexpectedly.
Choosing appropriate time frames affects the reliability of chart patterns. Patterns formed on a daily or four-hour chart typically carry more weight than those on a 15-minute chart, which might just reflect noise. For longer-term investors or swing traders, focusing on 4-hour to daily charts avoids the disruptions caused by intraday volatility, common in volatile pairs like USD/ZAR. On the other hand, scalpers may find shorter time frames useful, provided they verify patterns with volume and market context.
Moving averages (MAs) offer trend direction and dynamic support or resistance levels. When a chart pattern aligns with a moving average crossover, such as the 50-day crossing below the 200-day (a death cross), it reinforces the potential of a bearish reversal. Traders in Mzansi often use simple moving averages (SMAs) on the USDZAR chart to confirm momentum shifts alongside patterns like double tops. This can help avoid entering trades based solely on what the pattern “looks like”.
Relative Strength Index (RSI) measures momentum, helping to spot overbought or oversold conditions. An RSI above 70 combined with a reversal pattern, like a double top, signals a stronger chance of price falling back. Conversely, RSI under 30 with a double bottom suggests a possible bounce. Using RSI alongside chart patterns can improve timing and reduce false entries, especially in currency pairs susceptible to sudden moves during news releases.
Support and resistance levels are key anchors in price behaviour. A pattern forming right at a significant support level has a higher chance of success. For example, if an ascending triangle pattern emerges near a historical resistance level and breaks out with volume, it’s a better buy signal. Traders from Johannesburg to Cape Town rely on these horizontal zones to confirm the validity of patterns before committing to positions, as ignoring them often leads to whipsaws.
Aligning chart patterns with volume, time frames, and other indicators isn’t just best practice—it’s essential for cutting through market noise and making smarter trades. Treat patterns as one tool among many to increase your chances of success in the unpredictable Forex market.
Accessing trustworthy PDF resources on Forex chart patterns can greatly improve your trading knowledge and execution. Having reliable guides at hand helps you break down complex patterns into manageable learning steps while offering firm references you can consult during live trading. With countless charts and interpretations floating online, sticking to reputable sources ensures the material matches accurate market realities.
Broker educational websites often provide useful downloadable PDFs as part of their training resources. These materials come directly from brokers like IG, FXTM, or EasyEquities, who operate under strict regulatory frameworks, so the information tends to be well-balanced and up to date. For example, a broker PDF might offer detailed breakdowns of reversal patterns or continuity formations tailored to their trading platform's charting tools. This makes it easier to apply theory to practice without second-guessing whether content is trustworthy.
Forex training platforms also act as solid sources for chart pattern PDFs; platforms like BabyPips or FX Academy offer free or paid guides designed with beginners through to seasoned traders in mind. The advantage here is usually a structured curriculum that bundles pattern recognition with practical tutorials. These PDFs often include real market examples from global and emerging markets, including ones relevant to South African traders dealing with USD/ZAR pairs, making learning locally meaningful.
Trading communities and forums—such as Trade2Win or MyBroadband trading sections—can provide shared PDF resources recommended or created by experienced community members. While these might not always be officially vetted, strong user feedback and discussion threads offer an informal quality check. Besides PDFs, forums serve as live hubs where you can clarify doubts quickly and see how other traders interpret patterns under various market conditions.
Step-by-step tutorials in these PDFs break down each chart pattern into digestible actions—from identification to confirmation signals and trade execution steps. Having such detailed instructions helps prevent confusion when patterns appear on your charts in unpredictable ways. For instance, a tutorial might guide you through recognising a double bottom, validating it with volume trends, then setting entry and exit points with precise stop-loss placements.
Pattern recognition exercises included in some PDFs enable you to practice spotting patterns with historical chart snapshots. This hands-on learning solidifies your ability to quickly identify setups in live markets. Exercises might include spotting subtle differences between similar triangles or distinguishing valid pennants from false breakouts, both skills crucial to cutting losses and locking profits in South African Forex contexts.
Printable reference sheets act as quick cheatsheets you can pin beside your workstation or keep in your trading folder. These sheets summarise key patterns, expected movements, and confirmation indicators with clear visuals. They save time when you’re mid-trade and can’t pause for deep reading. Having a handy reference reduces errors and boosts confidence, especially during active sessions affected by factors like loadshedding interruptions or volatile currency moves impacting USD/ZAR or EUR/ZAR pairs.
Remember, consistent use of reliable PDFs sharpens your chart pattern knowledge and supports smarter decision-making. Choose sources wisely and integrate these materials into your daily trading routine for maximum benefit.
Recognising chart patterns is a skill, but traders often trip up by misreading or misapplying them. Understanding common pitfalls can protect your capital and sharpen your trading edge. It’s not just about spotting a pattern; it’s about knowing what it really means in market terms and how to manage risks properly.
Chart patterns aren’t a crystal ball. Relying solely on them to make trading decisions can lead to costly mistakes. For example, a head and shoulders pattern might appear perfect on a 4-hour chart, but if broader market indicators suggest a strong bullish trend, the reversal might fail. Traders sometimes jump into a trade triggered by a pattern without confirming with other tools, like volume or momentum indicators, only to find the price moves against them shortly after.
A practical approach is to treat chart patterns as one piece of the puzzle rather than a standalone signal. Combine patterns with other analysis methods and market news, especially in volatile Forex markets where rapid shifts happen frequently.
Ignoring the broader market context can lead to misreading patterns. For instance, a double bottom pattern forming during a strong downtrend might not signal the end of that trend but just a temporary pullback. Timing matters too—trading a pattern at the start of a major economic announcement can be a recipe for disappointment.
Successful traders look beyond the pattern shape. They check market sentiment, economic calendars, and geopolitical factors that may affect price moves. For instance, during a rand sell-off driven by political unrest, conventional chart signals could fail, making context king.
Even the best chart pattern predictions can go wrong. Setting stop-loss orders helps cap losses if the market moves against your position. For example, after identifying a bullish flag pattern, placing a stop-loss just below the flag’s lower boundary protects you if the breakout fails and the price dips.
Using stop-losses isn’t about playing it safe only; it enables disciplined trading. Without defined exit points, emotions can influence decisions, leading to holding losing trades for too long.
Managing how much you risk per trade is just as important. Betting too large on a single pattern can wipe out gains made over several good trades. A common guideline is risking no more than 1–2% of your trading capital per position. This keeps your portfolio balanced and cushions against a series of bad signals.
Timing your entry is crucial too. Jumping the gun on a pattern formation before it fully confirms, like entering a breakout trade prematurely, often leads to false entries. Waiting for a close above resistance or below support reduces this risk and aligns your trade with the market’s actual momentum.
Mistakes in chart pattern trading often come down to missing the bigger picture and underestimating risk management. Don’t just trust what the lines tell you—understand the story, check the facts, and protect your stake.
Refining your approach by learning these nuances will help you trade Forex charts with more confidence and less guesswork.
📈 Master key chart patterns for trading success! Discover their uses, pros, cons & find trusted PDF guides for South African investors wanting to improve skills.
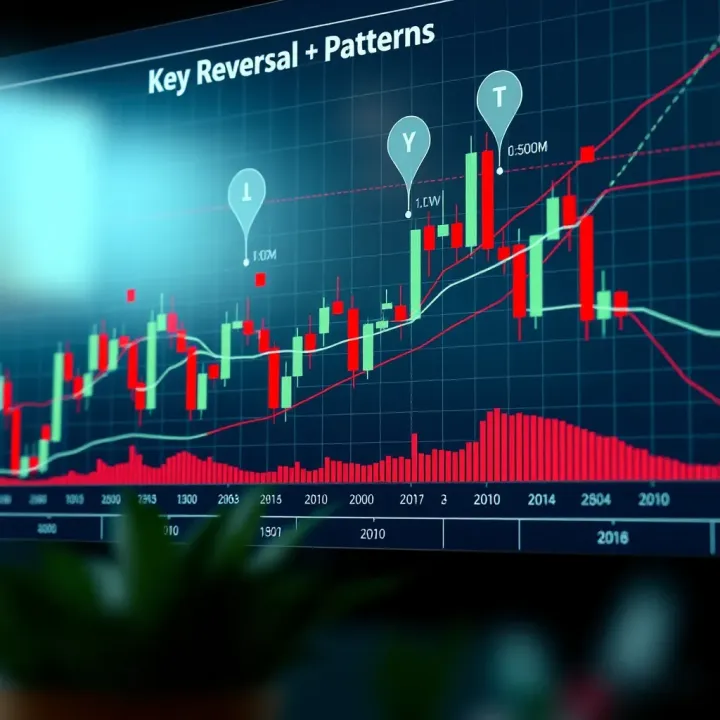
📈 Master reversal chart patterns with this practical guide! Learn how to spot key patterns and use PDFs to sharpen your trading skills in South Africa.

📊 Master key technical analysis chart patterns to predict markets confidently. Grab practical tips and find top PDF resources for smarter trading today! 📈

Discover how forex trading bots operate, their pros and cons, plus tips for South African traders on picking bots and managing risks 🤖📈 Start automating smartly today!
Based on 15 reviews