
Understanding Margin in Forex Trading
📉 Learn what margin means in forex trading, how it works with leverage, risks involved, and practical tips for South African traders staying within local rules.
Edited By
Henry Collins
Fibonacci retracement levels are widely used by traders to spot potential turning points in market prices. They rely on a sequence of numbers discovered by the Italian mathematician Leonardo Fibonacci centuries ago. In trading, these levels help identify areas where prices might stall, reverse, or continue their trend.

The basic idea is that after a significant price move — up or down — prices tend to pull back or retrace a predictable portion before resuming the original direction. Using key Fibonacci ratios such as 23.6%, 38.2%, 50%, 61.8%, and 78.6%, traders draw horizontal lines on charts to mark these potential support or resistance zones.
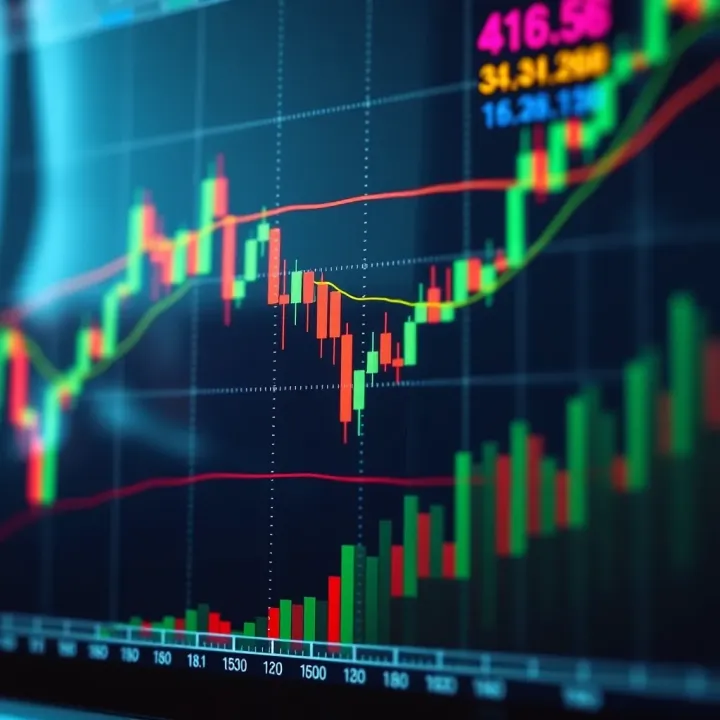
To plot Fibonacci retracements, traders pick the high and low points of a recent price swing. The difference between these two prices is multiplied by the Fibonacci ratios to find retracement levels. For example, if a stock rises from R100 to R150, the 38.2% retracement level would be at:
R150 - ((R150 - R100) x 0.382) = R150 - (R50 x 0.382) = R150 - R19.10 = R130.90
Traders watch for price reactions around these levels to enter or exit trades or adjust stop-loss orders.

## Practical Use in Trading

- **Identifying Entry Points:** Using retracements to find better prices before a trend resumes.
- **Setting Stop-Losses:** Positioning stops just beyond key Fibonacci levels to limit losses.
- **Spotting Take-Profit Zones:** Planning exits near these levels anticipating resistance or support.

Combining Fibonacci retracements with other tools like moving averages, RSI, or candlestick patterns usually improves trading accuracy.

Understanding Fibonacci retracement levels provides a grounded approach to price analysis. In South Africa's dynamic markets, combining them thoughtfully with local data and market trends helps traders make smarter decisions with precision and confidence.

## What Are Fibonacci Retracement Levels?

Fibonacci retracement levels are a popular tool used to identify potential support and resistance points during price movements in trading. They help traders spot where a market might pause or reverse direction after a strong move, which is crucial for making informed decisions about entry and exit points. For example, if a share on the JSE jumps from R100 to R150, a trader might use Fibonacci levels to estimate where a temporary pullback could stop, say around R130 or R120.

These retracement levels work best when combined with other indicators or chart patterns, rather than used on their own. That said, they offer a straightforward way to measure potential reversals and can help anticipate market behaviour, especially in markets with clear trends.

### Origins and Mathematical Basis

#### Intro to Fibonacci sequence

The Fibonacci sequence is a series of numbers starting from 0 and 1, where each following number is the sum of the two preceding ones (0, 1, 1, 2, 3, 5, 8, 13, and so on). It appears often in nature, such as in the arrangement of leaves or flower petals, which intrigued mathematicians and traders alike. In trading, the sequence offers a way to gauge natural proportions in market price movements.

[Understanding](/articles/understanding-margin-in-forex-trading/) this sequence helps in grasping why certain percentage retracement levels appear meaningful. The sequence itself doesn’t predict prices but highlights key ratios found in price swings.

#### Relation between Fibonacci numbers and retracement ratios

The magic lies in the ratios derived from the Fibonacci numbers, such as 61.8% (known as the golden ratio), 38.2%, and 23.6%. These percentages represent the size of the pullback relative to the previous move. For instance, the 61.8% ratio comes from dividing one Fibonacci number by the next (e.g., 21 ÷ 34 ≈ 0.618).

Traders use these ratios because they often correspond to significant price levels where markets tend to stall or reverse. So, if a stock surges sharply, a pullback near these percentages might signal a decent buying opportunity or a chance to exit before further decline.

#### Key percentage levels used in retracements

The commonly watched Fibonacci retracement levels are 23.6%, 38.2%, 50%, 61.8%, and sometimes 78.6%. Although 50% is not a true Fibonacci ratio, many traders include it due to its psychological importance.

Each level acts as a zone where price could find support (in an uptrend) or resistance (in a downtrend). For example, when trading Naspers shares, you might observe the price pulling back from a high to the 38.2% level before resuming the upward trend.

### How These Levels Are Calculated

#### Determining swing high and swing low

To calculate Fibonacci retracement levels, traders first identify the swing high and swing low on a chart — basically, the recent peak and trough in price. This range sets the basis for measuring retracement zones.

For example, if a particular share moves from R90 (swing low) to R130 (swing high), these points capture the entire move to measure retracements from.

Choosing the correct swing points is critical, yet sometimes subjective, especially in choppy markets. Using too small or too old swings can give misleading signals.

#### Calculating retracement zones on price charts

Once the high and low are set, the retracement levels are calculated by subtracting the swing range multiplied by each Fibonacci ratio from the swing high (in an uptrend) or adding to the swing low (in a downtrend).

Working with the R90 to R130 example:

- 23.6% retracement: R130 - (R40 × 0.236) = R121.54
- 38.2% retracement: R130 - (R40 × 0.382) = R114.72
- 50% retracement: R130 - (R40 × 0.5) = R110
- 61.8% retracement: R130 - (R40 × 0.618) = R104.72

Traders then watch how prices behave near these levels, using them as [guides](/articles/understanding-forex-trading-bots-guide/) to possible entry points, stop-loss placements, or profit targets.

> Forex and equity traders in [South Africa](/articles/understanding-derivative-trading-south-africa/) often mark these retracement zones on charts to navigate volatile sessions influenced by local factors like loadshedding or political developments. It adds a layer of quantifiable structure to market uncertainties.

Understanding what Fibonacci retracement levels represent and how to calculate them gives traders a useful edge. But the method performs best when combined with solid risk management and other chart analysis tools.

## Using Fibonacci Retracements in Trading

Fibonacci retracements are valuable tools for traders aiming to pinpoint areas where price may pause or reverse. These horizontal lines, drawn at key percentage levels, represent likely support and resistance zones derived from the Fibonacci sequence. Understanding how prices behave around these levels can offer traders a practical edge in timing entries and exits.

### Identifying Potential Support and Resistance

Prices often react noticeably near Fibonacci retracement lines, commonly pausing or reversing around the 38.2%, 50%, and 61.8% levels. For instance, if a stock in the JSE climbs sharply from R100 to R150 before pulling back, a retracement to around R130 (which might correspond to the 38.2% level) can act as a support area where buyers step in. This isn't a guaranteed floor, but many traders watch these levels closely, creating self-fulfilling dynamics.

On the flip side, these levels can also serve as resistance during a price rally. A share that has dropped from R150 to R100 and starts to recover may meet resistance near the 50% retracement at R125, where sellers could temporarily dominate. Recognising these zones helps traders prepare for potential price pauses.

Fibonacci retracements play a key role in anticipating market reversals. When price approaches a retracement zone, it often signals a potential shift in momentum. For example, after a sharp downtrend, a bounce off the 61.8% retracement might indicate buyers regaining control, marking a possible trend change. However, traders should combine this with other indicators to avoid traps, as retracement levels alone don't predict reversal certainty.

### Common Trading Strategies Involving Fibonacci Levels

Traders use Fibonacci retracements to identify entry and exit points by observing price action around these levels. Suppose a share pulls back to a 50% retracement level and forms a bullish reversal candle pattern; this might signal a good buying opportunity. Conversely, traders often look to partially take profits near these levels during upward movements, anticipating some resistance.

When placing stop-loss orders, Fibonacci zones offer logical placements just beyond key retracement percentages. For example, if entering a long trade near the 61.8% retracement, setting a stop-loss slightly below the 78.6% retracement level provides a buffer against normal price fluctuations while protecting from larger losses. This method helps manage risk by keeping stops close enough to limit downside but wide enough to avoid premature exits from minor price noise.

> **Tip:** Always combine Fibonacci retracement strategies with volume or momentum indicators to validate price behaviour before committing to a trade—this reduces the risk of false signals.

Understanding how to apply Fibonacci retracements practically—spotting support and resistance, timing entries and exits, and managing stops—gives traders a well-rounded approach to navigating price moves with more confidence and discipline.

## Integrating Fibonacci Retracements with Other Analysis Tools

Combining Fibonacci retracement levels with other technical tools strengthens a trader’s ability to make informed decisions. Since Fib retracements alone can give multiple potential support or resistance zones, pairing them with trend indicators and momentum tools helps filter out false signals and confirm valid price reactions. For South African markets, where volatility can spike during political or economic events, this combined approach offers more reliable trade setups.

### Combining with Trendlines and Moving Averages

#### Confirming signals with trend indicators

Trendlines and moving averages (MAs) add context to Fibonacci retracements by showing overall price direction. When a retracement level lines up with a rising trendline or a widely followed moving average like the 50-day MA, it strengthens the case for that Fib level acting as support or resistance. For example, if a retracement to the 38.2% level coincides with the 50-day MA on a JSE stock chart, traders may be more confident the price will bounce there.

This confirmation reduces uncertainty. Instead of reacting solely to the Fib levels, traders see them as part of a broader trend framework. That means fewer trades based on random pullbacks and more on genuine market behaviour.

#### Improving trade reliability using multiple tools

Relying on several signals helps avoid traps. Say the price reaches a 61.8% Fib retracement but is below the 200-day MA and the trendline is downward-sloping. Such mixed signals suggest caution, as the overall trend might override the Fib support. Conversely, if both trend indicators and Fib levels align, it enhances the trade’s reliability.

Combining tools also improves stop-loss placement. Stops placed just beyond a converging trendline and a Fib retracement zone are less prone to being hit by random noise. For traders in the volatile South African environment, this helps manage risk better.

### Use with Volume and Momentum Indicators

#### Using RSI and MACD to strengthen Fib analysis

Momentum indicators like the Relative Strength Index (RSI) and Moving Average Convergence Divergence (MACD) clarify whether price retracements have strength or are losing steam. When price approaches a key Fib level, an RSI below 30 signalling oversold conditions can hint at a likely reversal. On the other hand, if RSI maintains strength above 50 near a Fib level, the price may break through the zone instead.

Similarly, MACD crossovers that occur near Fibonacci levels add weight to entry or exit points. For instance, if the MACD line crosses above the signal line around the 50% retracement in a local share, it supports the possibility of a bounce, making the trade setup stronger.

#### Detecting false breakouts with volume data

Volume is a powerful way to vet Fibonacci-based signals. A breakout past a Fib retracement zone without increased volume often indicates a false move. For example, if Rand Group shares break above the 23.6% level, but volume remains light, traders should suspect a fakeout.

Conversely, a genuine breakout on above-average volume confirms commitment and heightens the chance of sustained moves. South African traders should watch volume patterns carefully, especially during earnings seasons or when news affects market sentiment, to avoid getting caught in traps.

> Integrating Fibonacci retracement levels with trend, momentum, and volume indicators is not about adding complexity but about making each trading decision smarter and less prone to error.

In summary, blending Fibonacci retracements with trendlines, moving averages, RSI, MACD, and volume data provides better clarity. This mix reduces guesswork, helping South African traders navigate choppy markets and make more confident moves on the JSE and beyond.

## Common Challenges and Misinterpretations

Fibonacci retracement levels offer valuable insights in trading, but they're not foolproof. Understanding the common pitfalls can help traders avoid costly mistakes and use these tools more effectively. This section explores the main challenges and misunderstandings that often trip up even experienced traders.

### Limitations of Fibonacci Retracements

#### Not a standalone prediction tool

Many traders expect Fibonacci retracement levels to predict exact price reversals or targets. The reality is more nuanced. These levels suggest potential support or resistance zones based on past price swings, but they don’t guarantee price will react exactly there. For example, a share on the JSE might bounce near a 61.8% retracement level, but that’s not a certainty—price could break through due to unexpected news or market sentiment shifts. Fib levels are better viewed as one tool among many, helping narrow down areas for closer attention rather than making firm predictions.

#### Subjectivity in choosing swing points

Determining which highs and lows form the basis of Fibonacci retracement calculations requires judgement. Traders may choose different swing points depending on the timeframe or market conditions. For instance, one might use the recent rally high and low on a daily chart, while another prefers weekly swings, leading to differing retracement zones. This subjectivity can affect the outcome, making Fib levels somewhat flexible rather than exact. Being consistent in selection and combining Fib with other indicators reduces this ambiguity.

### Avoiding Overreliance and Confirmation Bias

#### Recognising patterns that appear coincidental

It's easy to spot Fib levels under hindsight and fool oneself into thinking they predicted the moves. Confirmation bias may lead traders to see price reacting to Fib zones even when the connection is weak or random. For example, noticing price hesitation near a 38.2% retracement might seem significant, but it could well be coincidence amid volatile trading. Staying alert to this tendency prevents overconfidence in patterns that lack real predictive power.

#### Balancing Fib level analysis with market fundamentals

Relying solely on Fibonacci retracements ignores the broader market context. Economic reports, political developments, corporate results, or events like Eskom loadshedding often drive price moves beyond technical zones. A miner’s share might hold above a 50% retracement during calm markets, but if news breaks about new mining regulations or strikes, fundamentals can override the Fib levels. Combining retracement analysis with a solid understanding of fundamentals makes your trading decisions stronger and less prone to sudden shocks.

> Effective use of Fibonacci retracement levels depends on recognising their limits and integrating them with other tools and knowledge, especially in a dynamic market like South Africa’s.

By approaching Fib levels as helpful guides rather than precise forecasts, and by avoiding overconfidence in patterns, traders can increase the chance of making better calls and managing risks wisely.

## Applying Fibonacci Retracement Levels in the South African Market

Fibonacci retracement levels can offer valuable insights for traders in the South African market, particularly on the Johannesburg Stock Exchange (JSE). These levels help pinpoint potential support and resistance zones where price may reverse or stall. However, local market peculiarities—such as volatility from economic and political factors—demand some adaptation when using these retracement tools.

### Relevance for JSE and Local Shares

South African stocks often show clear reactions around Fibonacci retracement levels, making them practical for shaping entry and exit points. For instance, shares like Sasol or Naspers have displayed price pullbacks to the 38.2% or 61.8% levels following strong trends. These retracements sometimes coincide with historical support or resistance areas, reinforcing the level’s significance.

Adjusting your approach for local volatility is important. The JSE can experience sharp movements due to rand fluctuations, commodity price swings, and investor sentiment shifts. This means retracement levels might act more like zones than precise lines. Traders should allow a wider margin around key Fib levels and combine them with other indicators like moving averages or volume to confirm signals.

### Considerations During Economic and Political Changes

Loadshedding, ongoing policy adjustments, and geopolitical developments heavily influence South African price action. These events can cause sudden spikes or drops that override typical technical patterns, including Fibonacci retracements. For example, changes in mining regulations or unexpected Eskom interruptions may trigger volatile moves that test Fib levels without holding them firmly.

> Using Fibonacci retracement during uncertain times means it’s best to be cautious and rely on multiple analysis methods. Fib levels still provide a useful framework to gauge potential pullback areas, but confirming with fundamentals and market context helps prevent false signals.

In volatile or unpredictable conditions, such as election periods or global commodity shocks, traders should view retracements as guidelines rather than exact support or resistance points. Being flexible and ready to adjust stop-losses or take profits around these zones can improve risk management during disruption.

Overall, Fibonacci retracement levels remain a valuable addition to the South African trader’s toolkit, especially when adapted to local market rhythms and combined with broader analysis.📉 Learn what margin means in forex trading, how it works with leverage, risks involved, and practical tips for South African traders staying within local rules.
Discover how forex trading robots work 🤖, their pros and cons, types, risk tips, and future trends to boost your trading decisions successfully 📈.
📉 Learn how derivative trading works in South Africa: key contracts, risks, uses, plus local regulations to help you trade smart and manage your financial exposure effectively.
Discover how forex trading bots operate, their pros and cons, plus tips for South African traders on picking bots and managing risks 🤖📈 Start automating smartly today!
Based on 5 reviews